
The year is over! Here’s my training summaries for 2015. Data collected from Strava.com. This has been a great year for training. Some minor injuries, but I have recovered fully. I felt prepared for all the events that I participated and I didn’t get too sick this year either. All contributing to a strong training year.
Bike 2015:
| Distance | 2,805.9 mi |
| Time | 204h 24m |
| Elev Gain | 157,828 ft |
| Rides | 126 |
| Biggest Ride | 122.2 mi Mulholland Challenge 2015 |
| Biggest Climb | 7,016 ft Breathless Agony 2014 |
Run 2015:
| Distance | 464.3 mi |
| Time | 93h 30m |
| Elev Gain | 28,146 ft |
| Runs | 125 |
| Half-Marathon PR | 1:57:26 Fontana Half Marathon 2015 |
Swim:
| Distance | 275,092 yd |
| Time | 102h 15m |
| Swims | 133 |
Training Peaks Data:
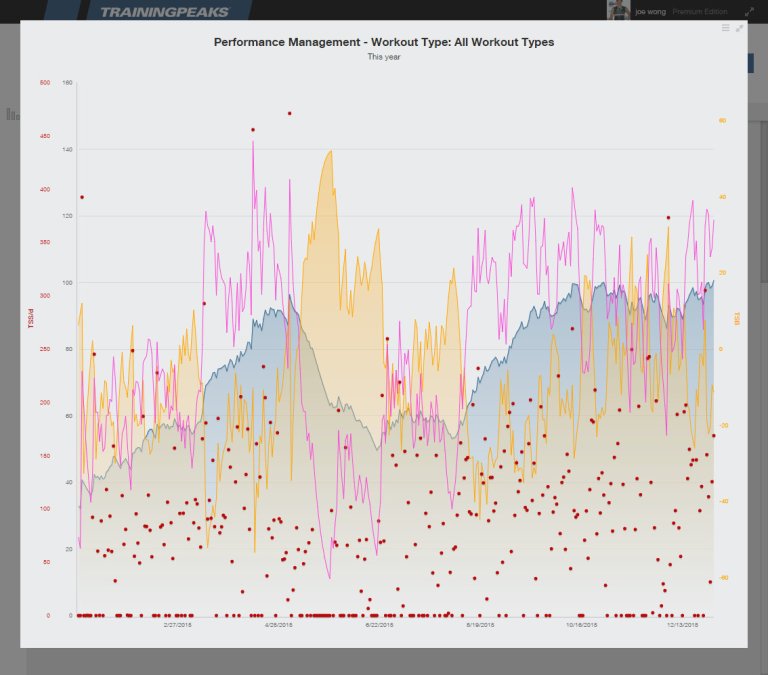
Acute Training Load (ATL Pink), Chronic Training Load (CTL Blue), Training Stress Balance (TSB Yellow). You can see Peak in May for Ironman St. George Utah 70.3. A lull from May through July, then a ramp up in August when I decide Full Ironman in 2016. I started coaching with Barry and started working hard August through December. Same Garmin Data pushed to Strava and Training Peaks.
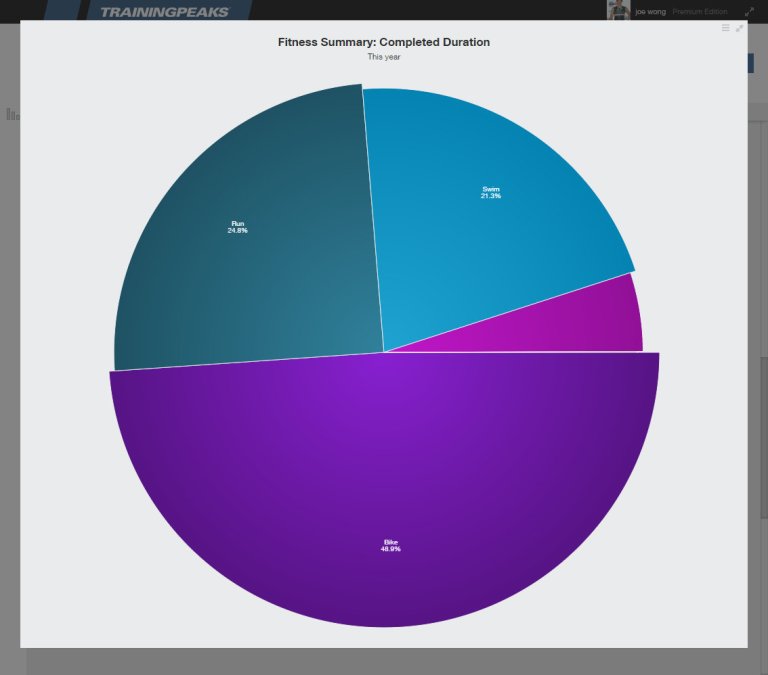
Looking at all the hours over the year, here’s the percentage breakdown.
Bike: 48.9%, Run 24.8%, Swim 21.3%, Other (strength and yoga) 4.9%
Strava compiled summary videos:
Bike:
http://2015.strava.com/video/kU3JbxF
Run:
http://2015.strava.com/video/ggmAOml
