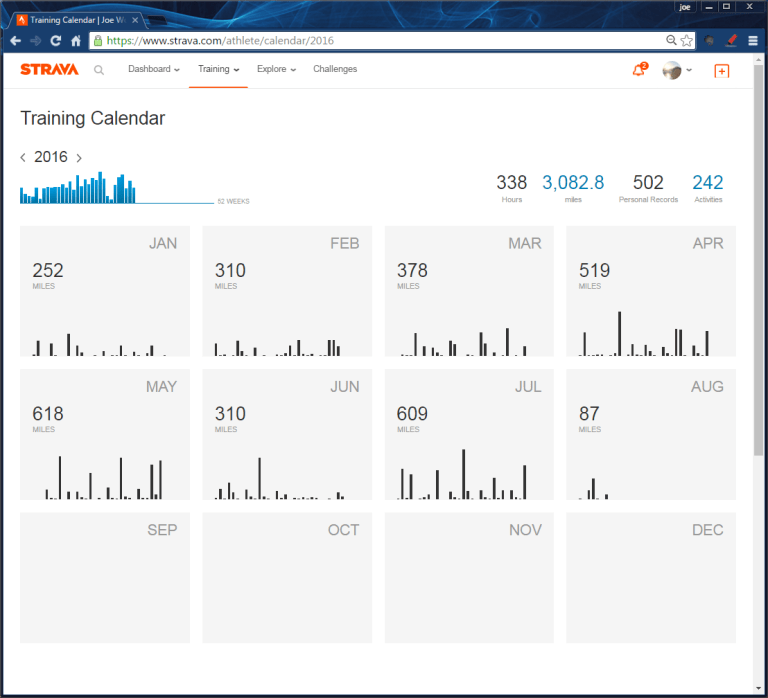
Training for Ironman is winding down. Here’s the summary data for my Ironman Training. I plotted the summary data from Strava to see any trends. For same time period in 2016, 45% increase in hours in training, 56% increase in miles, 4% increase in PRs, 10% increase in activities.
| Jan-July 2014 | Jan-July 2015 | Jan-July 2016 | Increase 2016 over 2015 | |
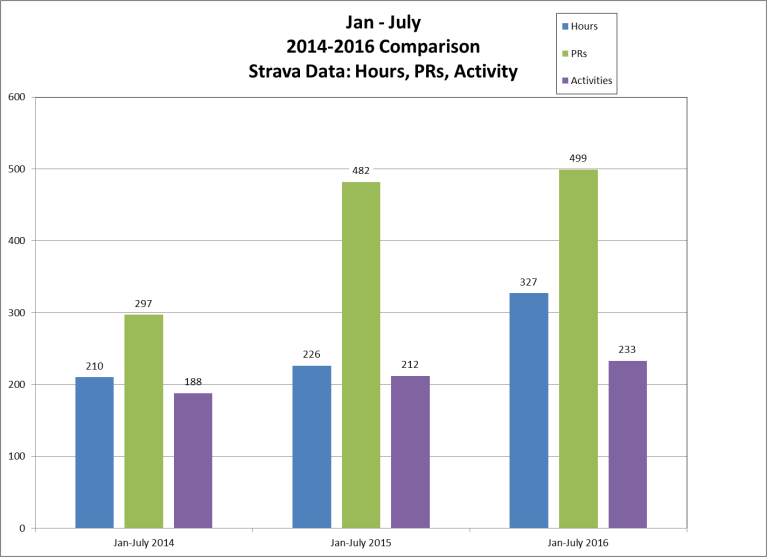
| Hours | 210 | 226 | 327 | 145% |
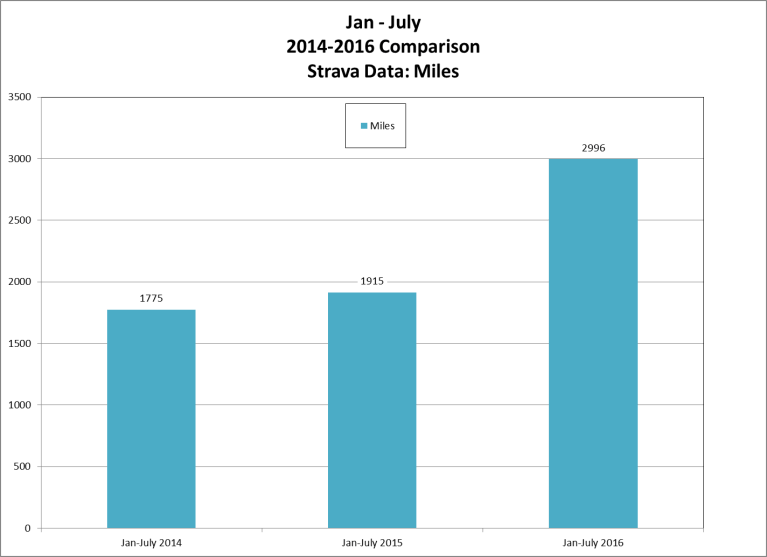
| Miles | 1775 | 1915 | 2996 | 156% |
| PRs | 297 | 482 | 499 | 104% |
| Activities | 188 | 212 | 233 | 110% |
Miles: 1081 more during the same period than last year. That’s 2.8x from my house to San Francisco.
Hours: 101 more hours spent training in the same period last year. That’s the tradeoff. from sleeping, watching TV, and chilling at home.
PRs: About the same amount of PR’s as last year. It’s funny that I keep breaking records at the same rate.
Activities: 10% more activites, but significantly longer and farther.
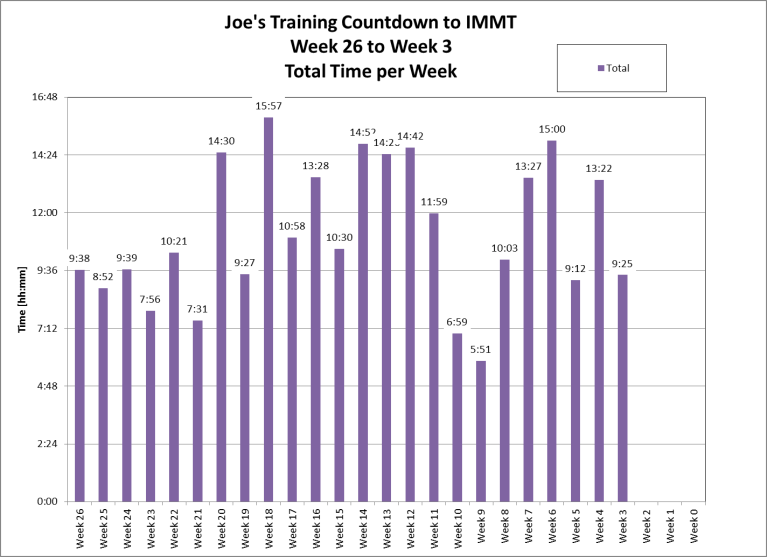
Time: Max’d out on possible hours in a week. 6 weeks had more and 14hrs. This is maximizing the hours in your life and focusing them in one spot.
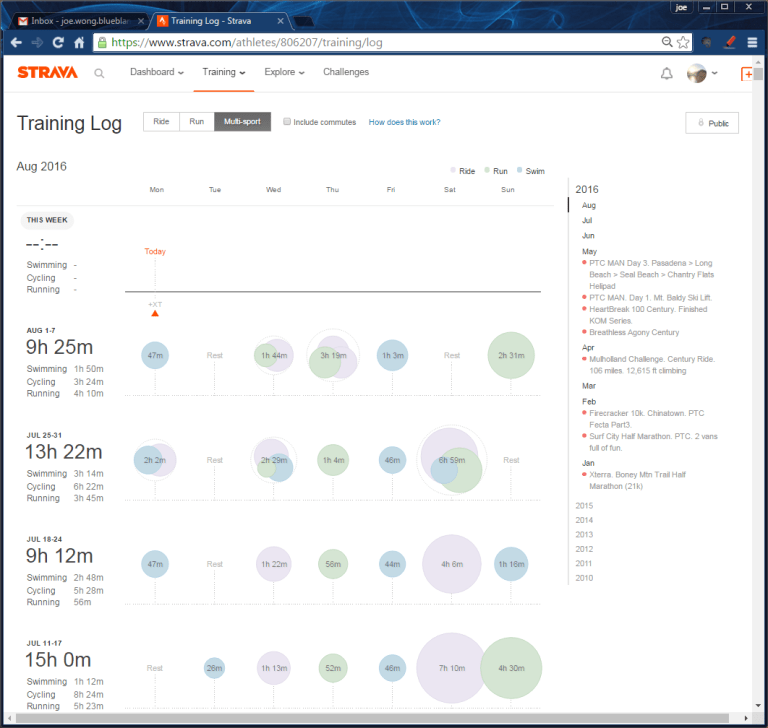
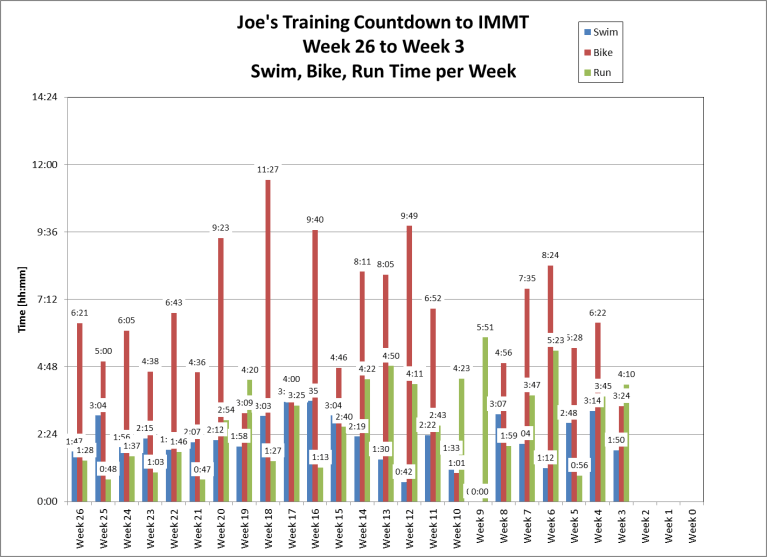
This is the spread across swim, bike, run, by hours. You can easily spot the Vacation Tim, with no bike and no swim.
Here’s the screens from Strava: Calendar and Training Log